
Towards Automating Spacecraft Conjunction Assessment with AI
There’s no denying it– there are a lot of satellites in orbit around the Earth. As we enter a new era of near-daily launches and mega-constellations, the risk of two satellites colliding in space is increasing.
Earlier this year, I started thinking about how AI could help us predict future satellite collisions– or, conjunctions. I began by simulating a set of 10 spacecraft in near-circular orbits. Each orbit has a slightly different altitude (± 1 km) and eccentricity, e ∈ [0.0, 0.001].

Using the simulated data, we can look at the distances between pairs of spacecraft over time. The plots below show these distances over a 6-hour period. The period of each orbit is approximately 90 min.
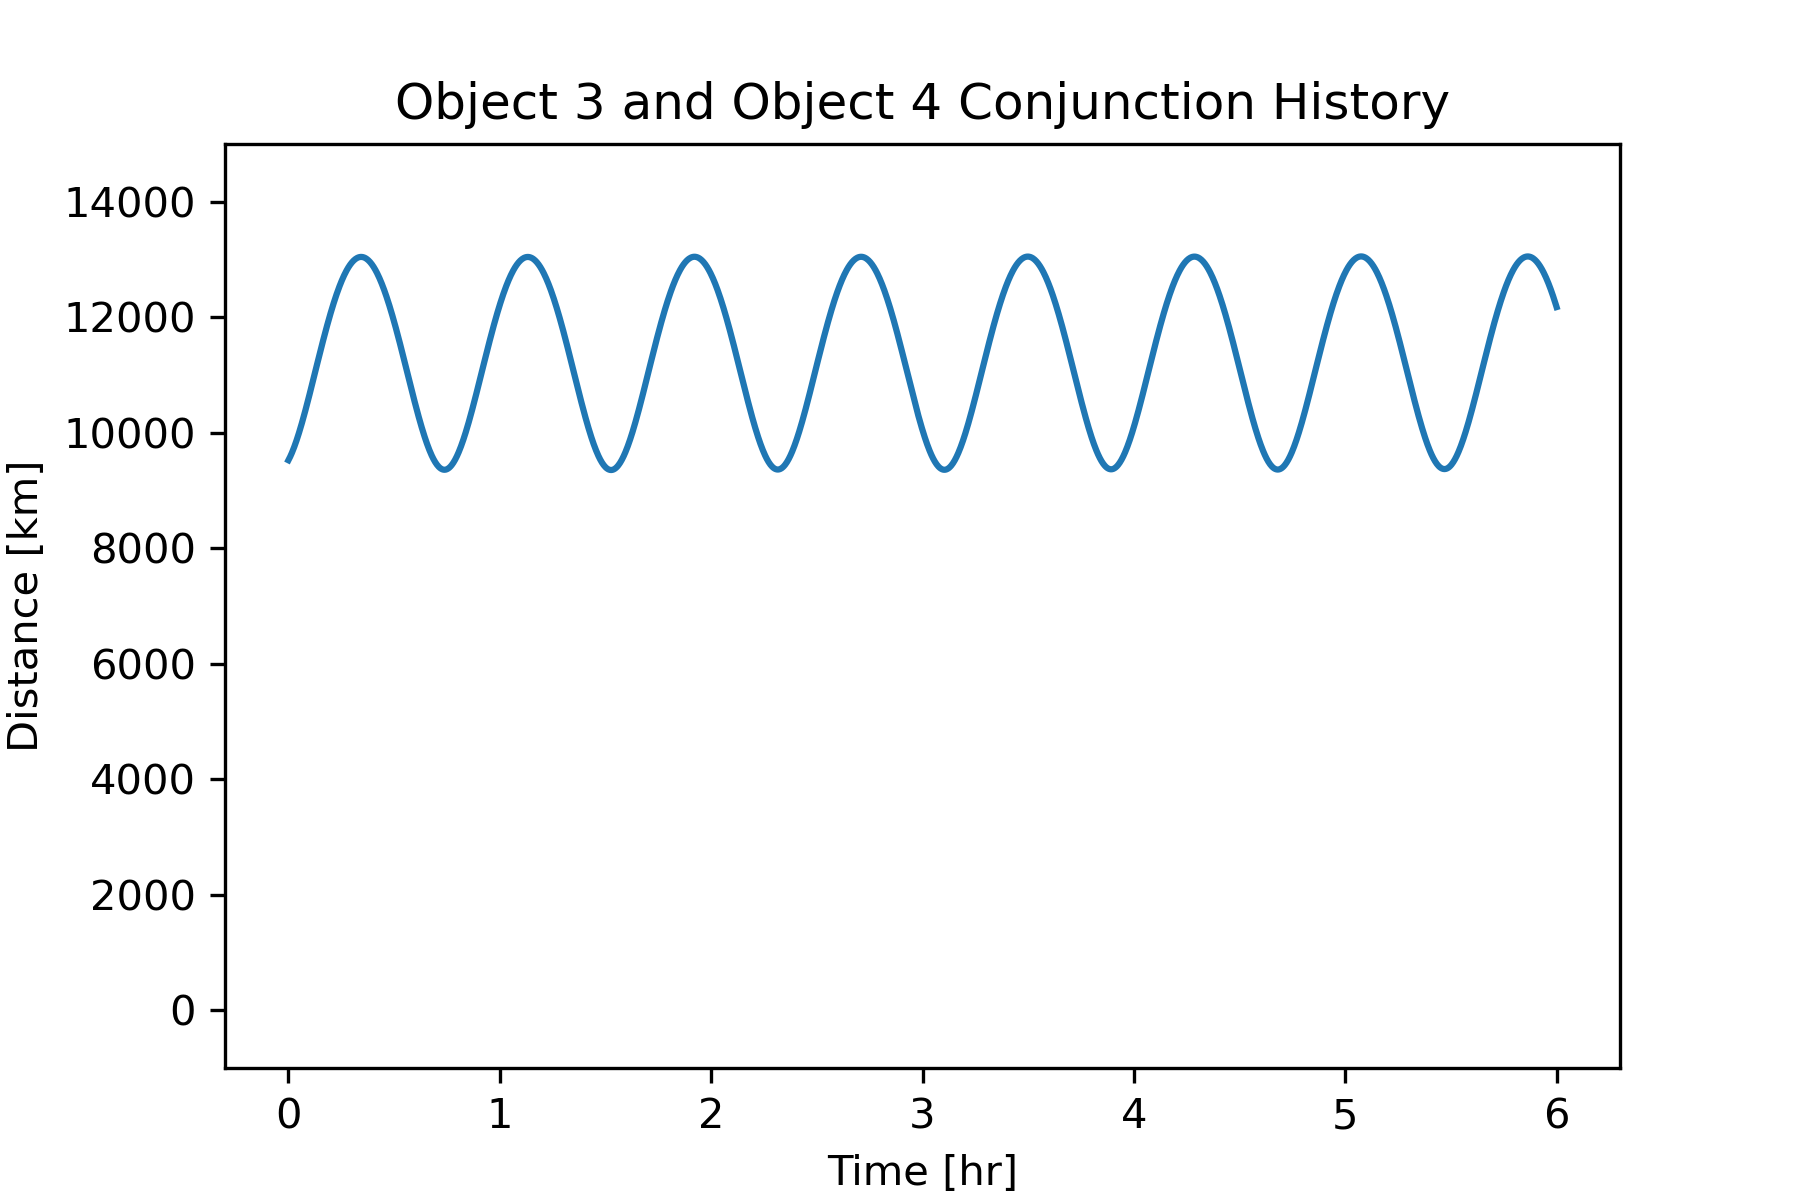
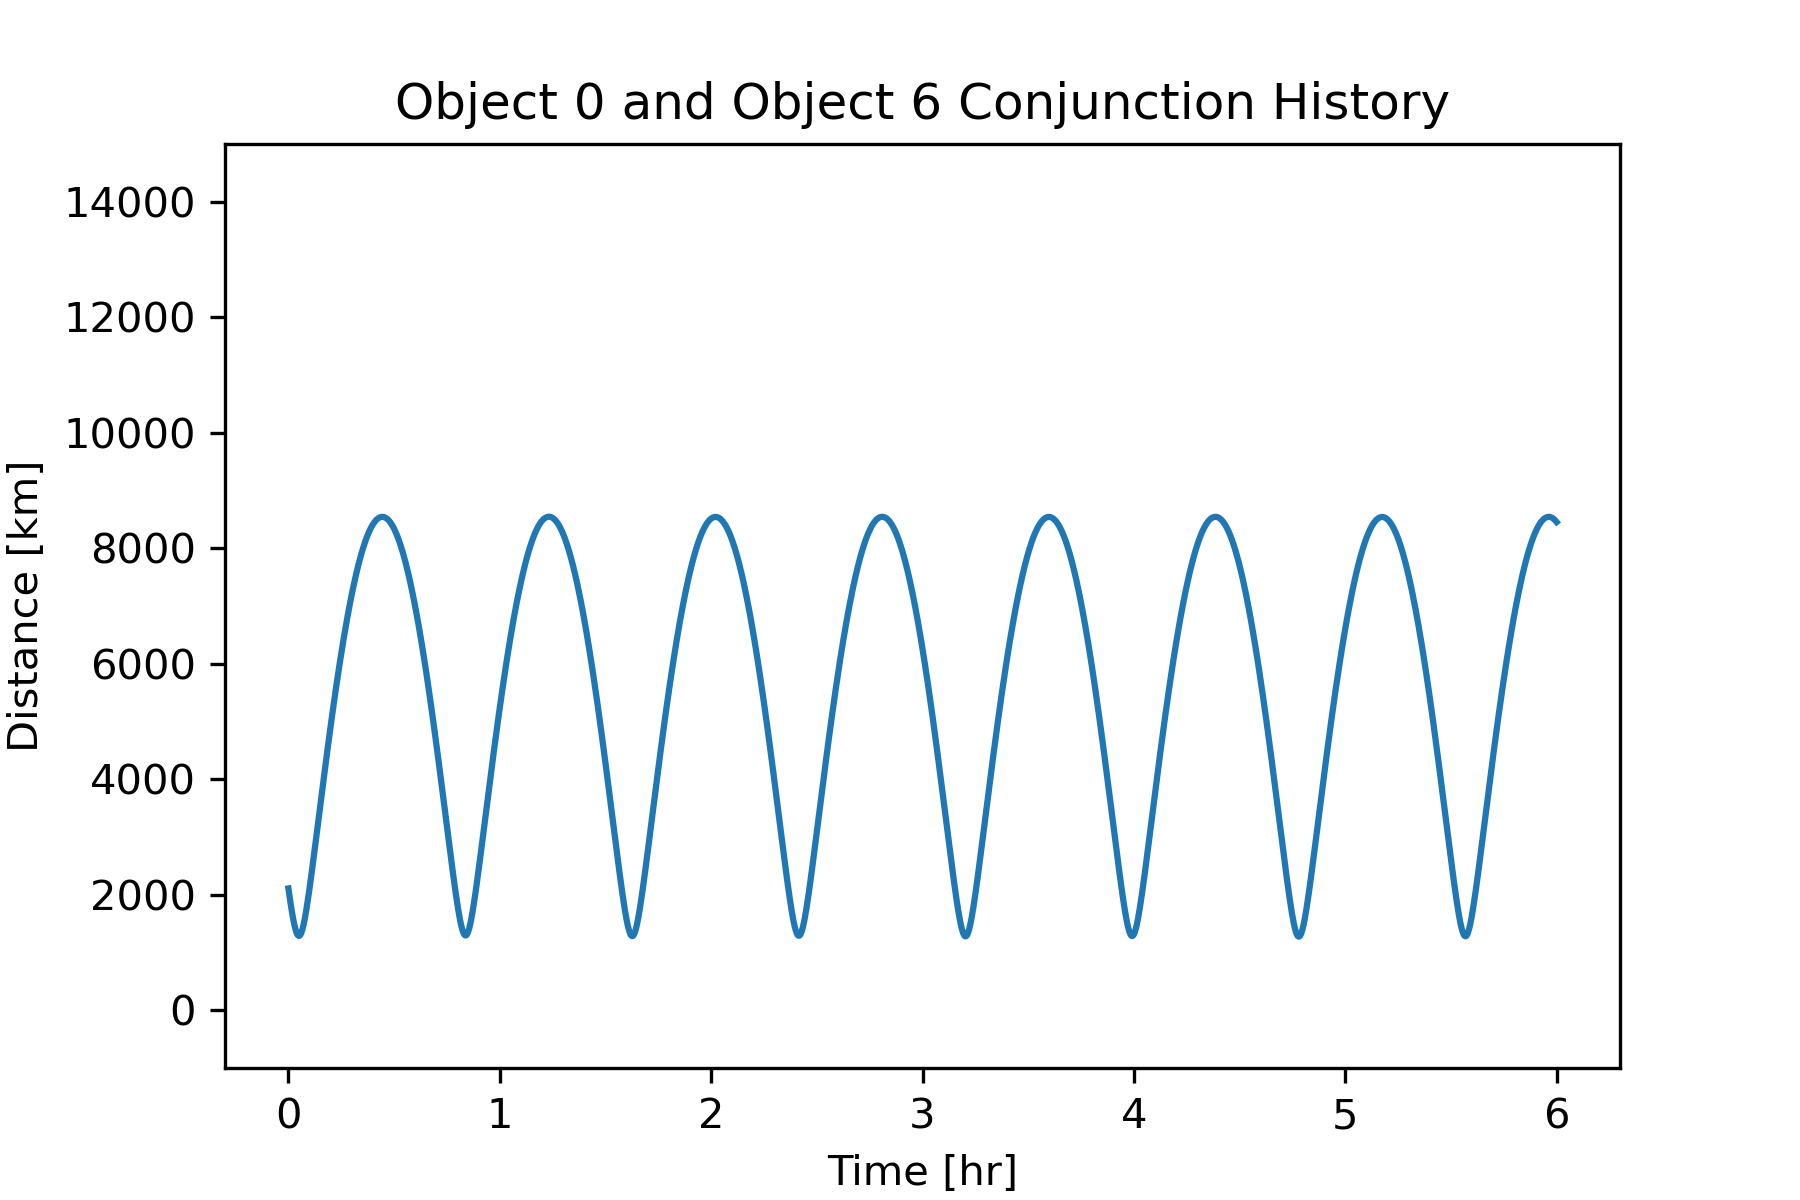
Over this short timespan, Objects 3 and 4 stay far away from each other. The minimum distance between them is over 9000 km. However, Objects 0 and 6 are sometimes as close as about 1500 km apart. This is, of course, still very far apart as far as conjunction assessment is concerned!
Now, let’s look at longer-term trends. These figures show the distances between the same object pairs, but this time over a span of 514 days. Potential conjunctions (d < 100 km) are flagged in red.
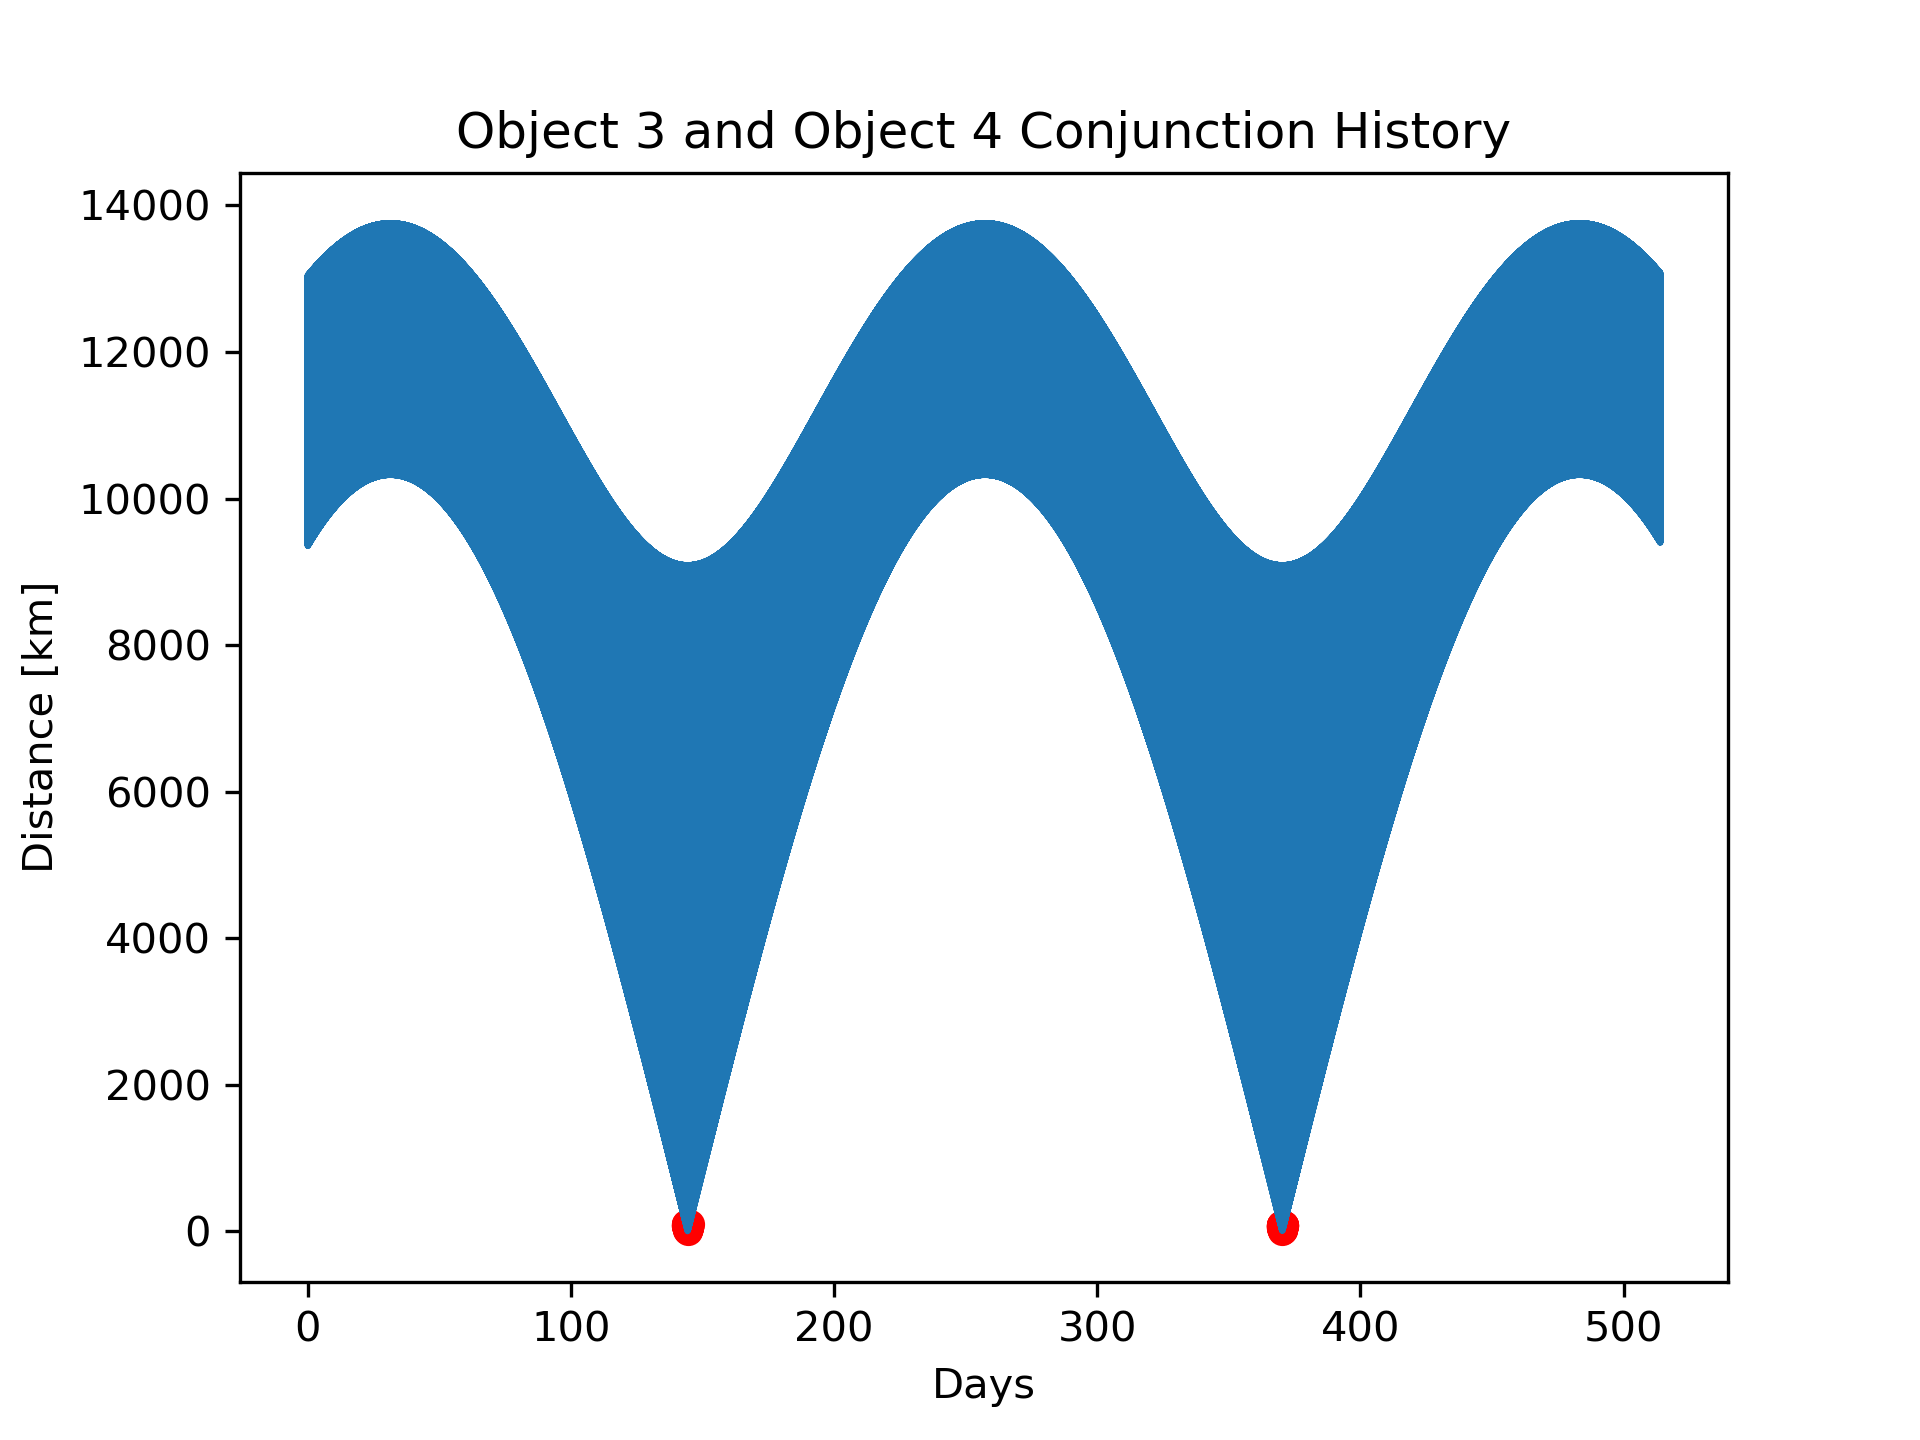
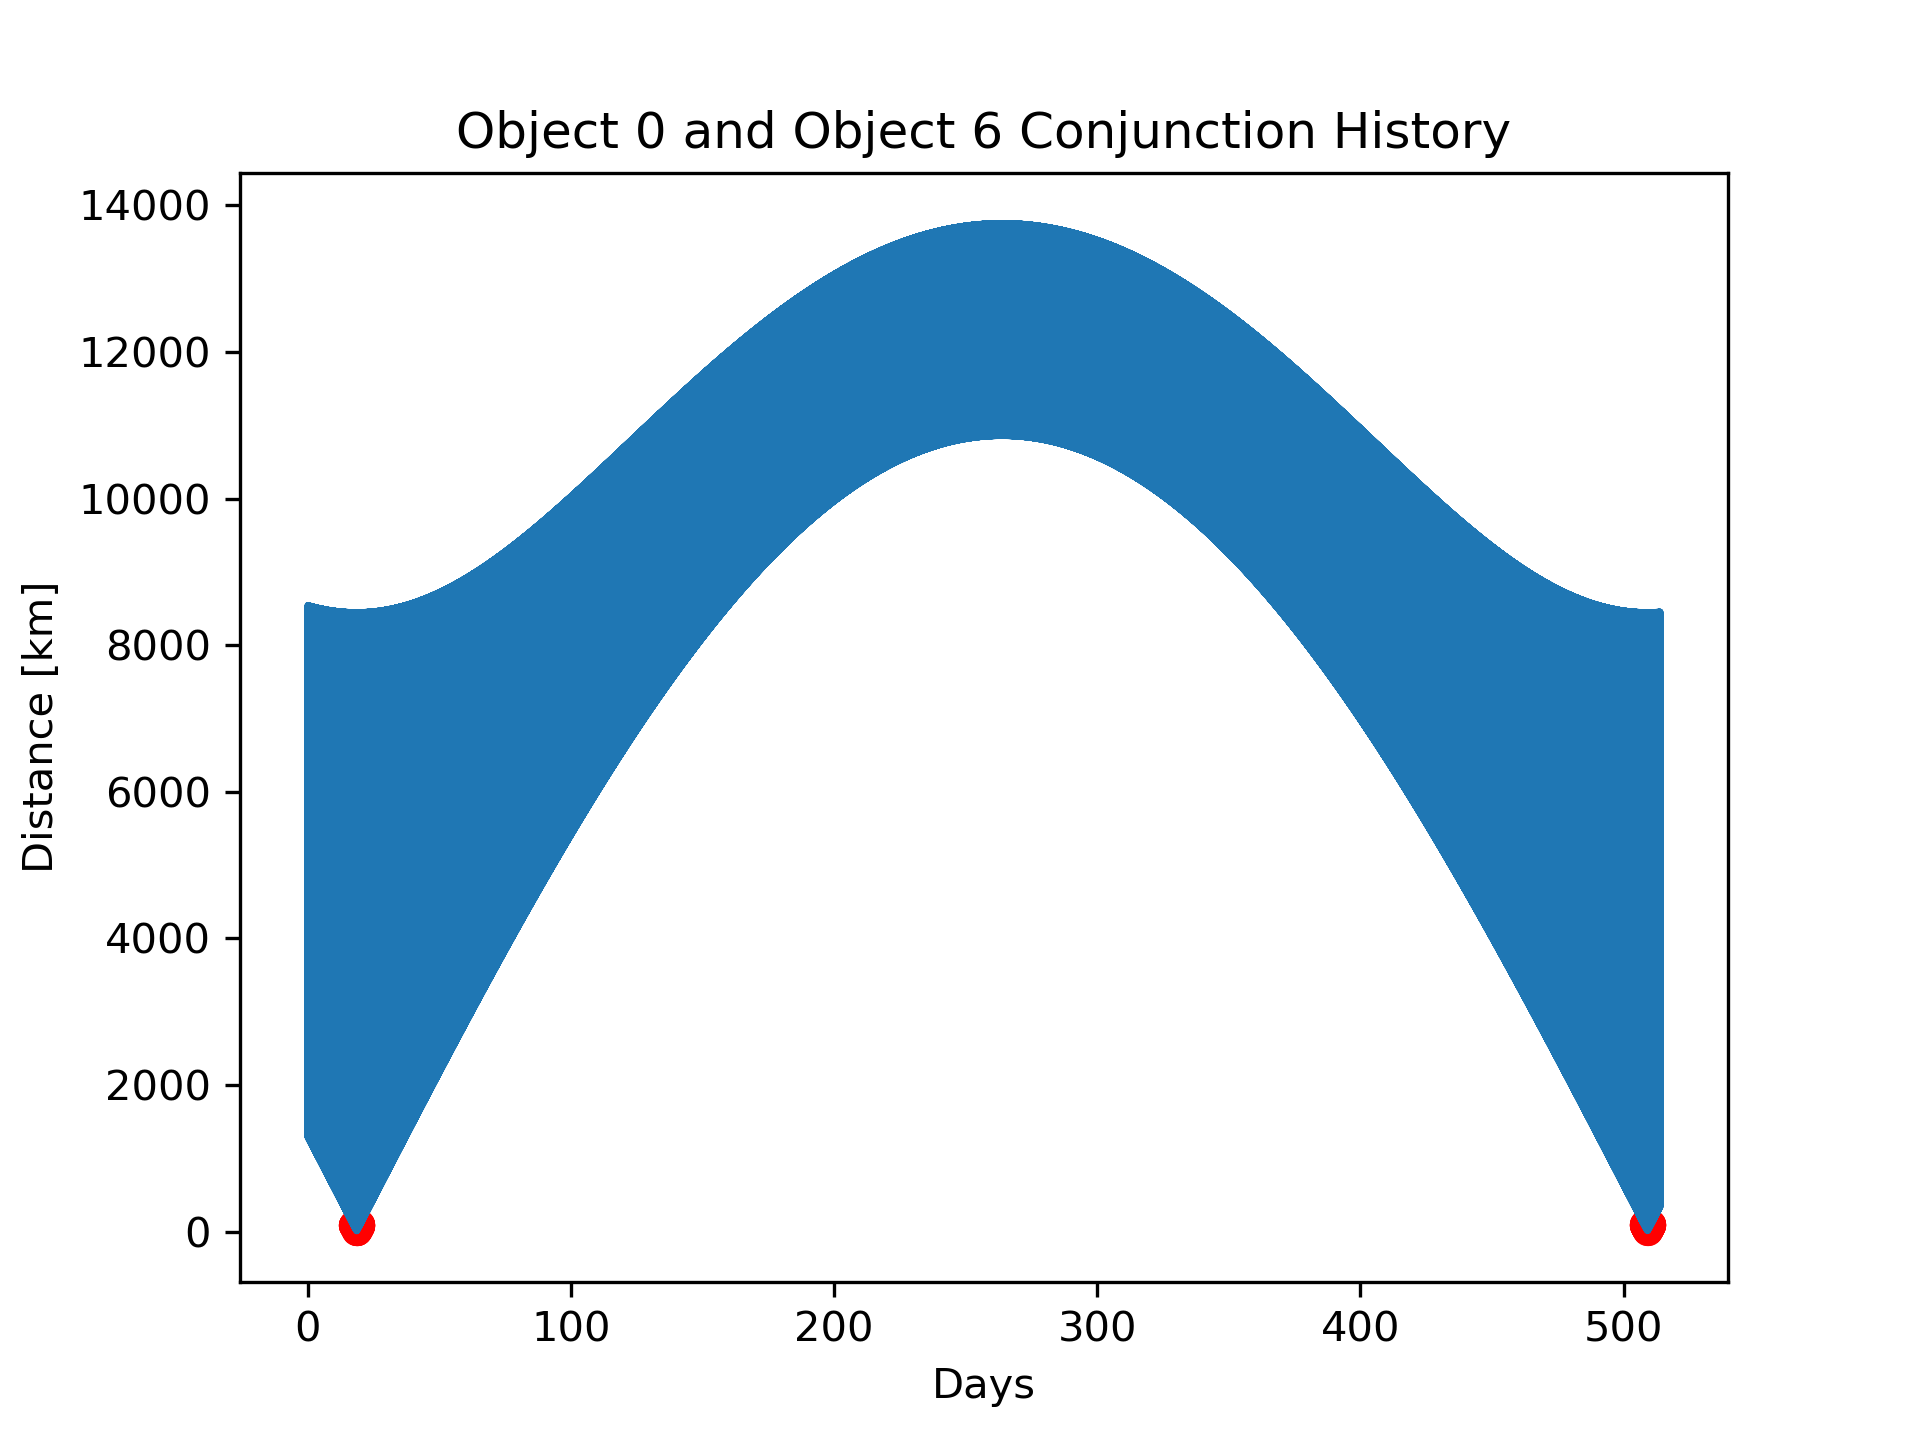
The distance histories now appear as thick bands, since the short-term oscilations are obscured by the longer time scale. Clearly, there is some structure in the signal over the longer time span. For both pairs of objects, many conjunctions occur together in short bursts. Then, the objects stay far away from each other for a long time.
The goal is to train an AI model to flag potential conjunctions in the near future.
One challenge in forecasting conjunctions with the distance history data we’ve seen so far is the strong seasonal oscillation pattern; the rapid changes in distance over the 90 minute orbital period.
Instead of training on the distance data directly, I formed datasets of the rolling mean and amplitude of the distance signal. By predicting the future mean and amplitude of the distance values, we can forecast the minimum distance between the spacecraft in the two-week prediction period.
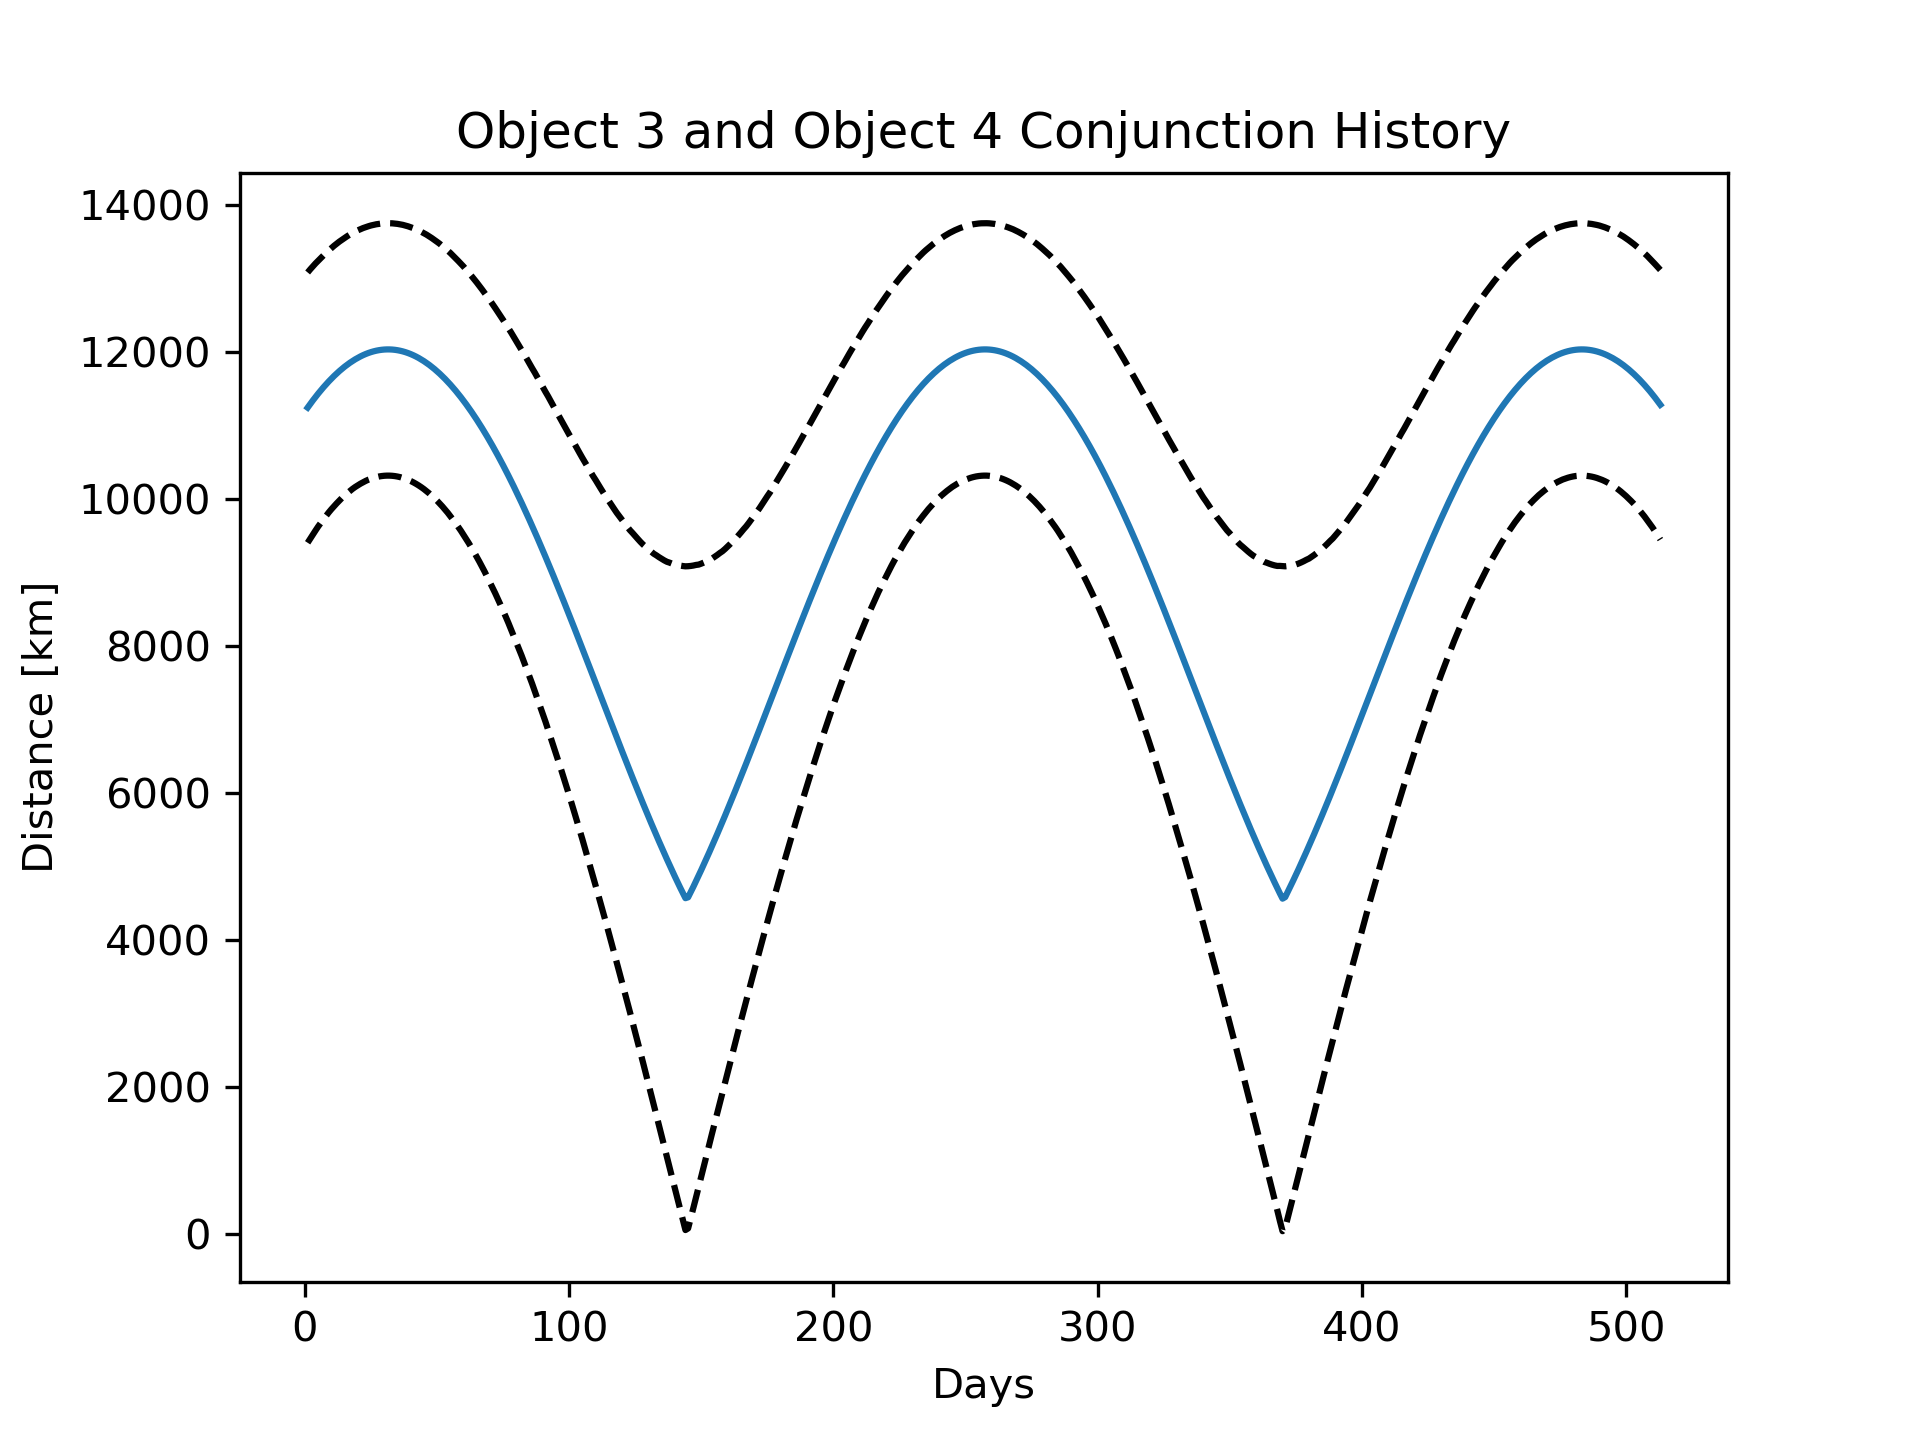
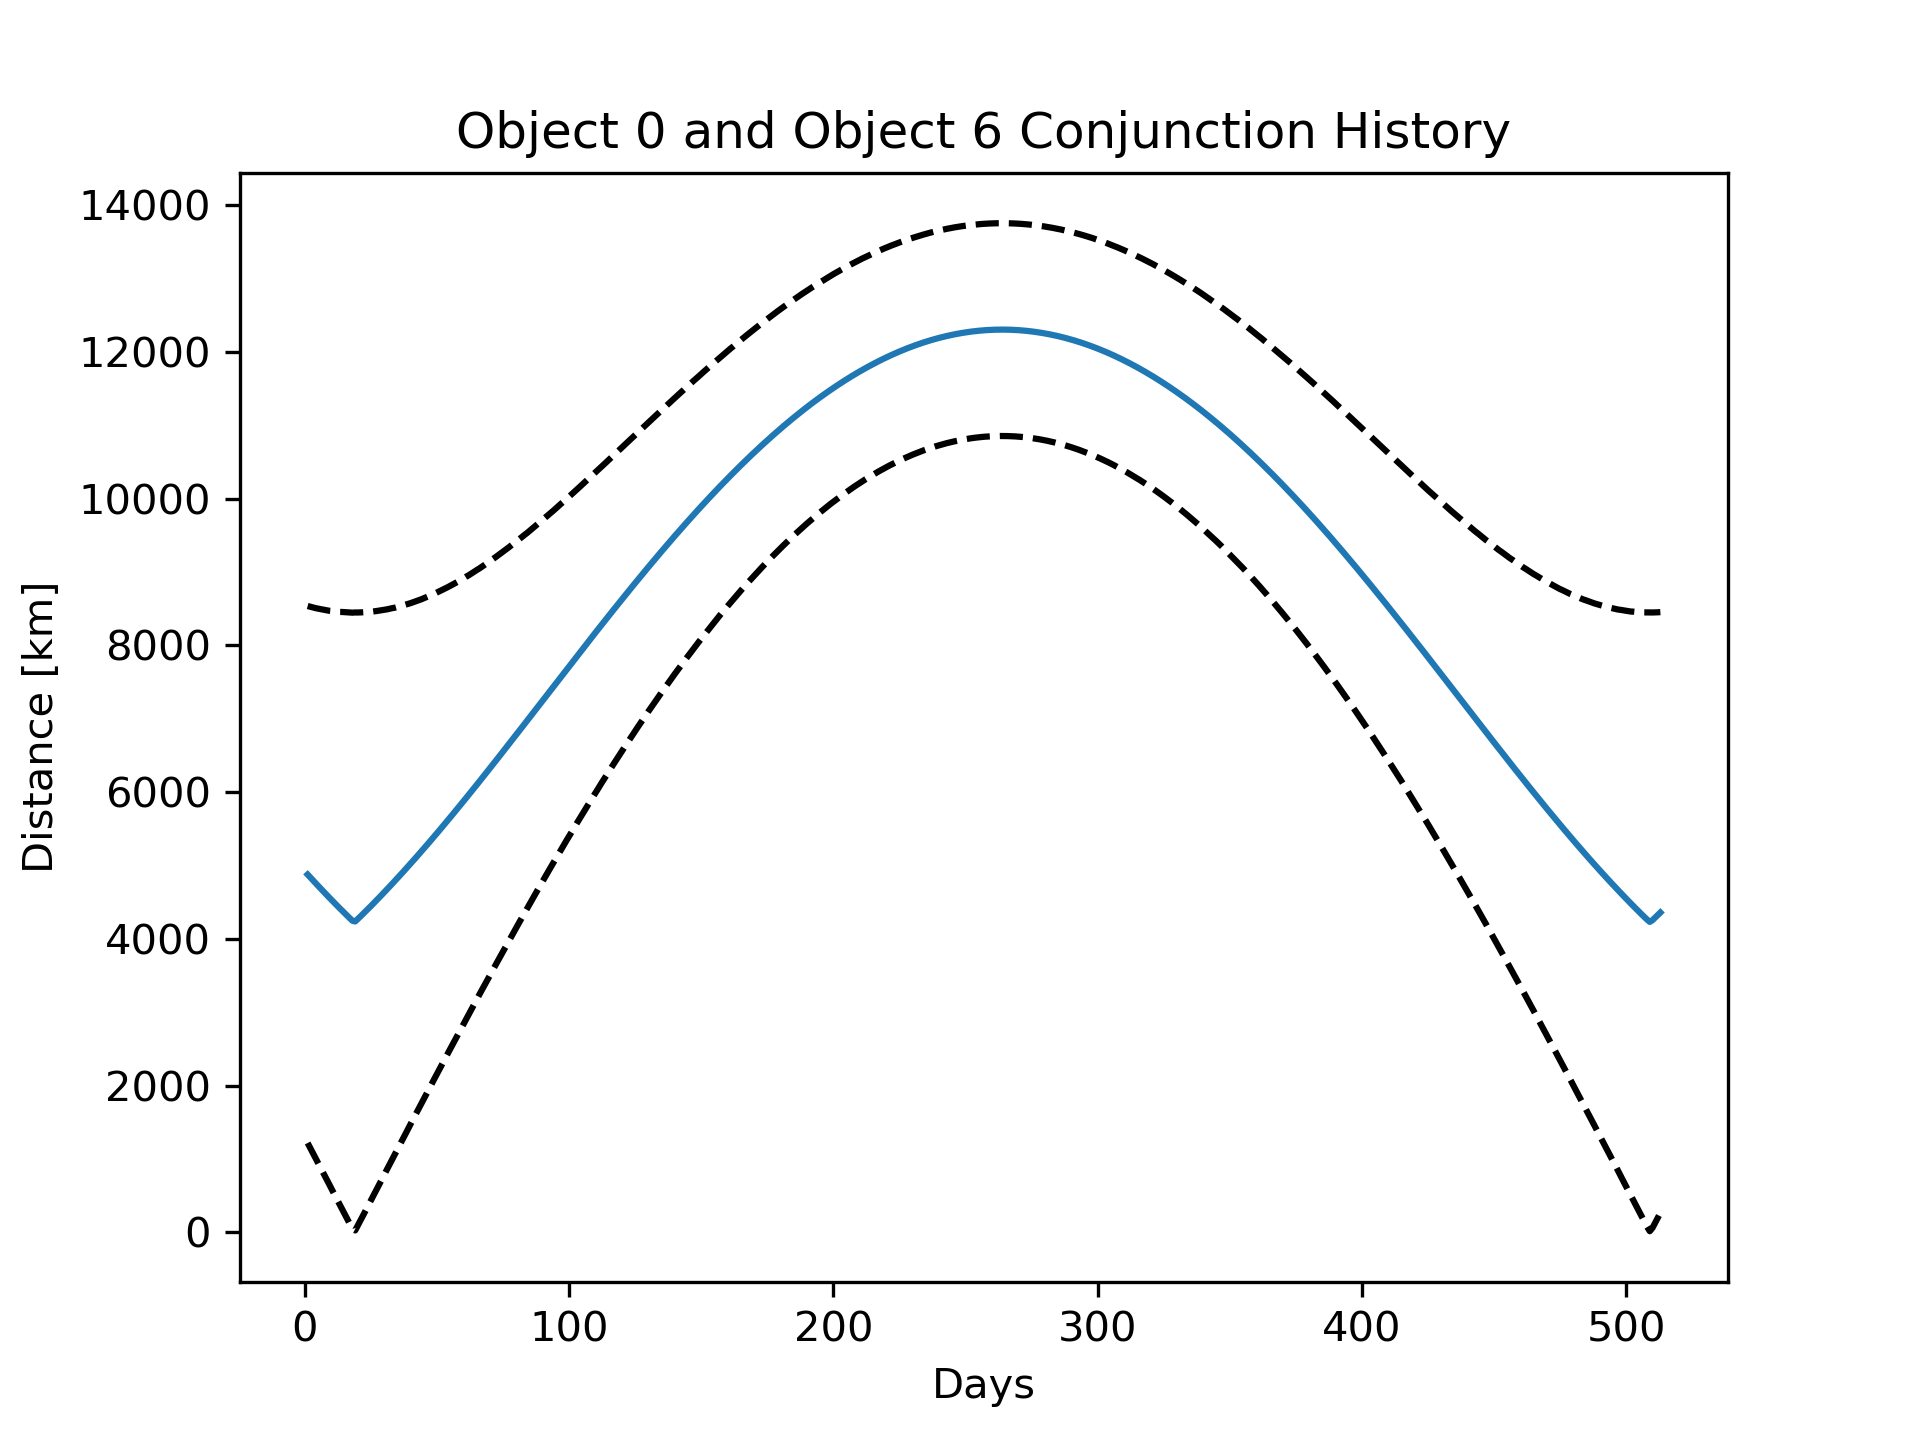
A two-layer RNN was trained on the first 500 days of mean and amplitude data for each pair of satellites. Then, I used each neural network to predict the mean and amplitude values two weeks into the future.


In these figures, the true distance between the objects is plotted in blue. The predicted mean, minimum, and maximum distances are plotted in black. Objects 3 and 4 do not experience any conjunctions in the two-week prediction period. The neural network confirms this. The minimum predicted distance between the two objects is close to 10,000 km. Objects 0 and 6 would be flagged; clearly, they experience many close approaches.
In the future, approaches like this one will improve conjunction screening by flagging potential conjunctions– and, perhaps more importantly, filtering out pairs of objects that will certainly not experience a conjunction during the forecast period. Flagged potential conjunctions can then undergo a more computationally expensive screening process to determine the danger of collision.
Code for this project is available on Github.
Selected References
Emma Stevenson, Victor Rodriguez-Fernandez, Hodei Urrutxua, David Camacho. “Benchmarking Deep Learning Approaches for All-vs-All Conjunction Screening.” Advances in Space Research, 2023.
James Woodburn, Vincent Coppola, and Frank Stoner. “A Description of Filters for Minimizing the time Required for Orbital Conjunction Computations.” Advances in the Astronautical Sciences, 2009.
RNN PyTorch Time Series Tutorial: Complete Guide to Implementation